¶ Feb 2026 Changes
¶  Gold Mining Balance Update
¶  What changed?
¶  Gold mining now scales less aggressively at high probe counts
- At low and mid probe counts, gold mining behaves the same as before.
- At very high probe counts, gold mining is now less profitable than previously.
- This prevents extreme late-game probe stacking from massively outperforming other strategies.
To keep things transparent, we’ve added a full comparison table (old vs new values).
 You’ll have access to the entire Excel sheet, so you can see exactly where and how the curve changes.
¶  Probe losses for gold mining were reworked
This is the part that interacts with shielding:
- Base probe losses for gold mining were increased
- Shielded probe effectiveness was increased to 60%
 What this means in practice:
- If your probes are shielded, total losses remain the same as before
- If your probes are not shielded, losses now increase more steeply than they used to
So:
 Shielding is now more important and more rewarding
 Unshielded gold mining is riskier than before
¶  Why we made this change
- Reduce runaway scaling at extreme probe counts
- Make gold mining decisions more strategic at high levels
- Reinforce shielding as an important mechanic, not an optional one
- Keep early and mid-game behavior familiar and predictable
¶  TL;DR
TL;DR
- Low / mid probes → no real change
- High probes → less gold than before
- Shielded probes → same losses as before
- Unshielded probes → higher losses
https://docs.google.com/spreadsheets/d/1XTwfVVYQ6x2WR9TGoyF4x5aD8dZHPLPfDuIrP9x_zio/
¶ 🛠️ Old Formula
Previously, the gold mined was calculated simply:
- Up to 15,000 probes:
gold = probes × 6.5 - Beyond 15,000 probes:
gold = (15,000 × 6.5) + ((probes - 15,000) × 2.5)
This provided a steady but linear progression. It also had a cap on how much can be mined.
¶ ✨ New Formula
The updated formula introduces a dynamic calculation to encourage more strategic gameplay:
-
0 to 15,000 probes:
gold = 6.5 × probes -
15,001 to 30,000 probes:
gold = -9,809,020 × (probes ^ -0.378512) + 355,088 -
30,001 to 859,400 probes:
gold = 14.1692 × (probes ^ 0.847744) + 68,473.3 -
859,401 probes and above:
gold = 1.5 × probes + 300,000
¶ 🧢 Gold Mining Cap
Although the new formula allows for dynamic scaling, there is still a maximum cap on how much gold can be mined per tick. The cap is calculated as:
gold_cap = 100,000 + (Residences × 50) + (Star Mines × 100)
This cap ensures that regardless of how many probes are deployed, the total gold mined per tick cannot exceed this limit. To increase the cap, players must invest in building more Residences and Star Mines, reinforcing the importance of infrastructure in maximizing gold yield.
¶ 📊 Comparisons by Game Phase
Early Game Comparison
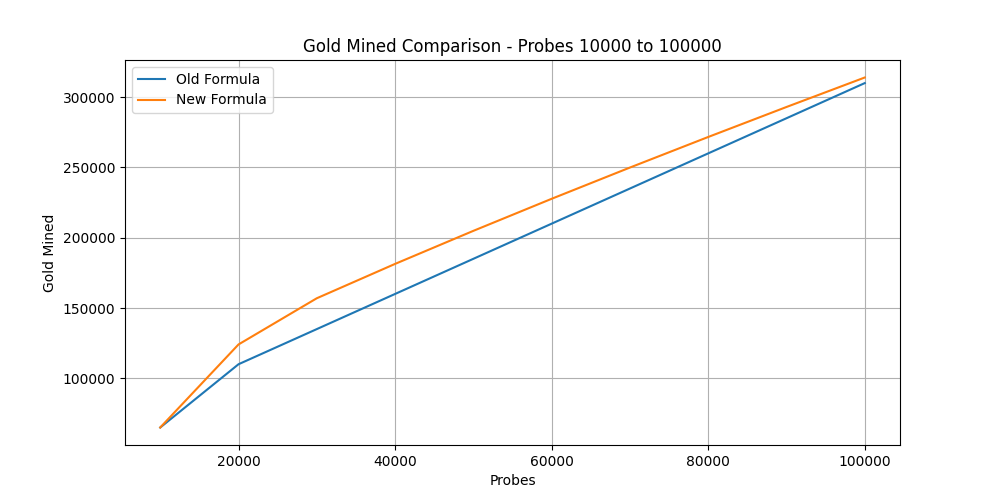

| Probes | Old Gold | New Gold | Old Gold/Probe | New Gold/Probe |
|---|---|---|---|---|
| 10,000 | 65,000 | 65,000 | 6.5 | 6.5 |
| 20,000 | 110,000 | 124,076 | 5.5 | 6.2038 |
| 30,000 | 135,000 | 156,943 | 4.5 | 5.2314 |
| 40,000 | 160,000 | 181,378 | 4.0 | 4.5344 |
| 50,000 | 185,000 | 204,890 | 3.7 | 4.0978 |
| 60,000 | 210,000 | 227,692 | 3.5 | 3.7949 |
| 70,000 | 235,000 | 249,919 | 3.3571 | 3.5703 |
| 80,000 | 260,000 | 271,667 | 3.25 | 3.3958 |
| 90,000 | 285,000 | 293,003 | 3.1667 | 3.2556 |
| 100,000 | 310,000 | 313,981 | 3.1 | 3.1398 |
Mid-Game Comparison
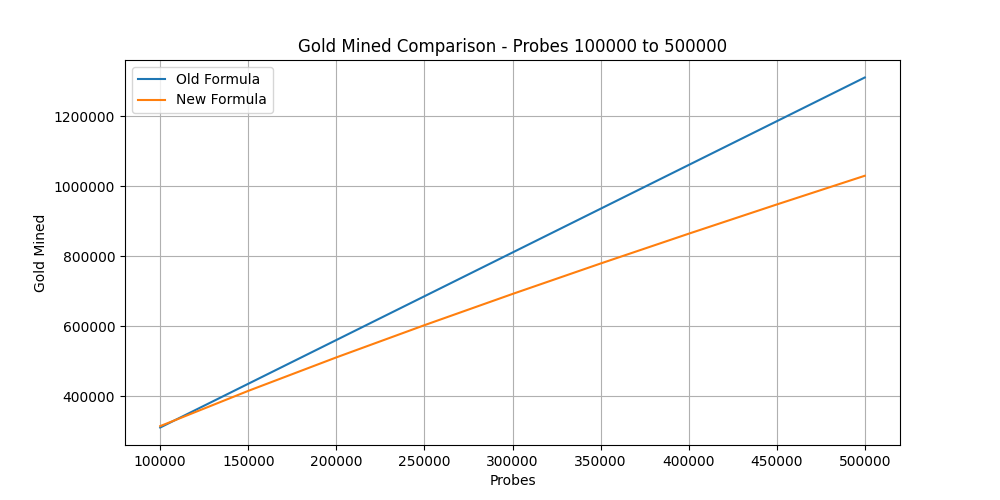
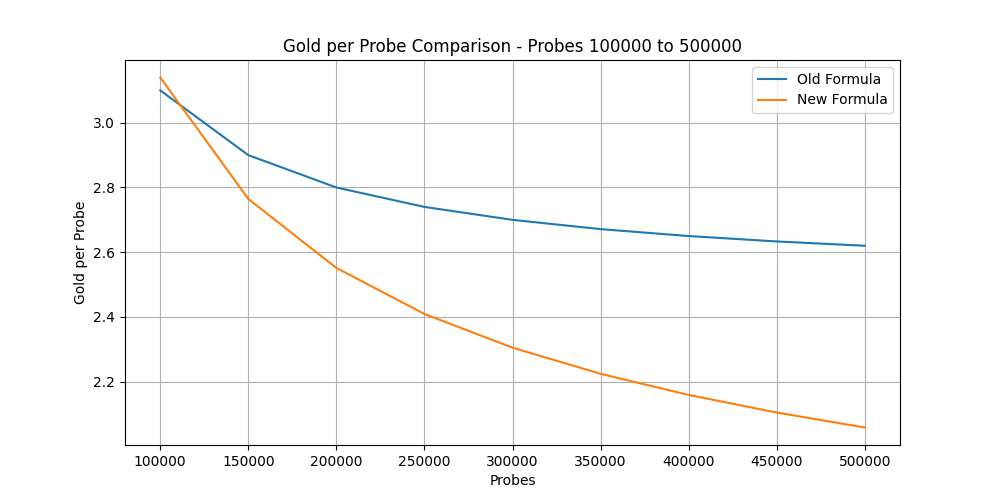
| Probes | Old Gold | New Gold | Old Gold/Probe | New Gold/Probe |
|---|---|---|---|---|
| 100,000 | 310,000 | 313,981 | 3.1 | 3.1398 |
| 150,000 | 435,000 | 414,688 | 2.9 | 2.7646 |
| 200,000 | 560,000 | 510,309 | 2.8 | 2.5515 |
| 250,000 | 685,000 | 602,320 | 2.74 | 2.4093 |
| 300,000 | 810,000 | 691,550 | 2.7 | 2.3052 |
| 350,000 | 935,000 | 778,534 | 2.6714 | 2.2244 |
| 400,000 | 1,060,000 | 863,639 | 2.65 | 2.1591 |
| 450,000 | 1,185,000 | 947,136 | 2.6333 | 2.1047 |
| 500,000 | 1,310,000 | 1,029,228 | 2.62 | 2.0585 |
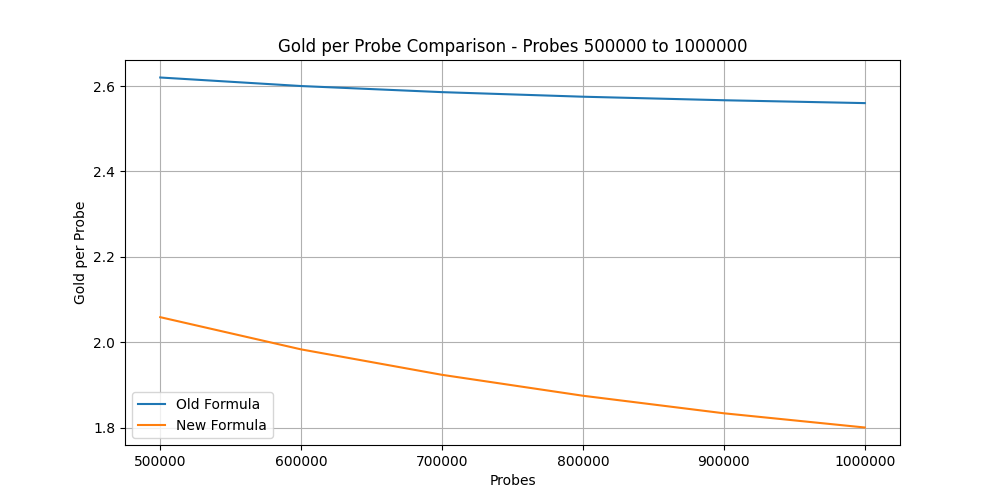
Late Game Comparison
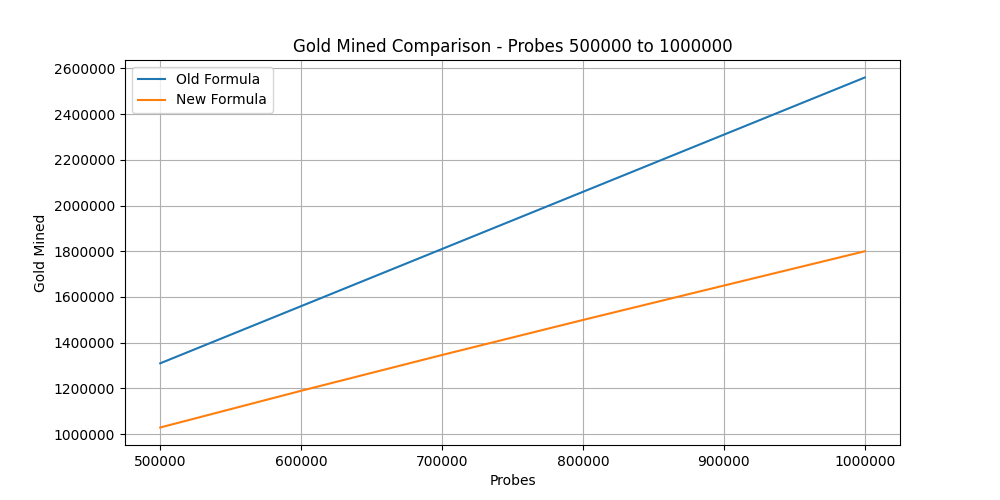
| Probes | Old Gold | New Gold | Old Gold/Probe | New Gold/Probe |
|---|---|---|---|---|
| 500,000 | 1,310,000 | 1,029,228 | 2.62 | 2.0585 |
| 600,000 | 1,560,000 | 1,189,816 | 2.6 | 1.983 |
| 700,000 | 1,810,000 | 1,346,359 | 2.5857 | 1.9234 |
| 800,000 | 2,060,000 | 1,499,522 | 2.575 | 1.8744 |
| 900,000 | 2,310,000 | 1,650,000 | 2.5667 | 1.8333 |
| 1,000,000 | 2,560,000 | 1,800,000 | 2.56 | 1.8 |
¶ 📈 Why the Change?
The goal is to encourage strategic decision-making regarding probe investments and balance the interaction between probes and Star Mines. Early-game probes now deliver stronger returns, promoting initial growth. However, in later stages, strategic consideration becomes crucial, as the diminishing returns per probe mean players will need to balance probe investments with other growth opportunities such as Star Mines.